Showing posts with label Informative Topics. Show all posts

Wednesday, 25 May 2011

Most Stolen Cars in USA

10. 2009 Toyota Corolla
Trade-In Value*: $11,100
Original Price in 2009: $15,910
New  Car Value (2011): $17,400
The Toyota Corolla is one of the “best loved cars in America” according to Kelley Blue Book . It rates high on maintenance and resale value — and it gets decent gas mileage. The 2011 had just “minor cosmetic changes,” which means parts from prior year models can be used in the newer models, which makes the car very attractive to car thieves Roughly 800,000 to one million cars are stolen in America every single year. Many of the same models are on the list every year but it’s not just because they’re the most popular vehicles.
 It’s primarily because they have parts that don’t change much from year to year – and most cars are stolen for the parts, not to drive around, explained Geoff Keah, a special investigator for assurance . So, thieves who steal a 1994 model, for example, could sell the parts to use in models for 1995, 1996, etc. 09 more images after the break...


09. 2002 Ford Explorer
Trade-In Value*: $4,350
Original Price in 2002: $27,775
New Car Value (2011): $30,000

The Ford Explorer is one of the most popular SUVs on the market. People love the vehicle because it has the functionality of an SUV but also has style and comfort. Because they’re so popular, Ford hasn’t made too many changes in subsequent models, except for improvements to safety and roominess. You know what that means — thieves love them for the parts!

08. 1994 Acura Integra
Trade-In Value*: $625
Original Price in 1994: $16,695
New Car Value (2011): N/A

The Integra makes the stolen list because it was a popular vehicle that Honda made from 1985 to 2007 that people liked to buy and soup up “Fast and Furious” style with everything from engine modification to enhanced suspension and blinged-up wheels, Keah explains.

07. 1994 Chevrolet Pickup
Trade-In Value*: $1,200
Original Price in 1994: $16,322
New Car Value (2011): $20,800

Pickup trucks like the 1994 Chevy Silverado are extremely popular, particularly in Texas and the south. In Texas, for example, they’re often stolen and then driven across the border into Mexico where they’re harder to recover.

06.  2000 Dodge Caravan
Trade-In Value*: $1,450
Original Price in 2000: $21,905
New Car Value (2011): $24,800

The Dodge Caravan is a popular minivan that is a big hit among soccer moms in places like Michigan and, as a result, thieves, who steal them for their parts. Thieves love the older models because they lack anti-theft devices and they have valuable parts like airbags and catalytic converters. The Caravan is so popular in Michigan, that five of the top 10 most stolen vehicles in Michigan are Caravans (the 2000, the 1999, the 1998, the 1997 and the 1996).

05. 2004 Dodge Ram Pickup

Trade-In Value*: $5,050
Original Price in 2004: $22,295
New Car Value (2011): $20,100

Pickup trucks like the Ram are stolen for valuable parts such as the wheels and tailgates, Keah said. Tailgates can often get mangled in an accident and the new ones are expensive to replace since they often have cameras for backing up in them. (A tailgate with a camera can set you back $1,000 to $1,500.) Plus, the older ones are easy to steal, he said.

04. 1997 Ford F-150 Pickup
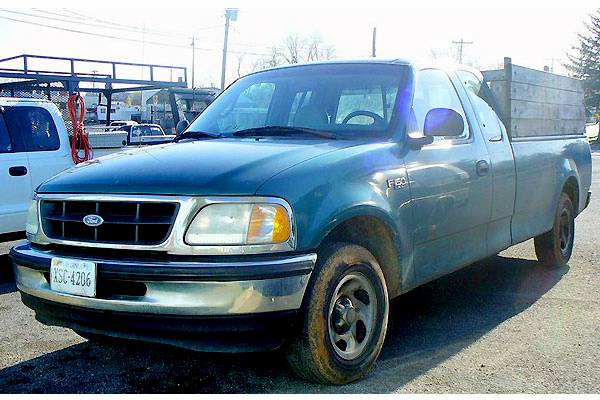
Trade-In Value*: $1,200
Original Price in 1997: $17,480
New Car Value (2011): $22,600

Ford has been making its best-selling F-series pickup trucks since 1948 and for most of that time the F-150 has not only been the best-selling truck in America but the best-selling vehicle in America. That means there will always be a market for parts — and for thieves, who love those older models. 1997, incidentally, marked Ford’s first redesign of the F-150 since 1980. It was also the model where Ford introduced the rounded nose, a risky move given the F-150?s popularity.

03. 1991 Toyota Camry
Trade-In Value*: $700
Original Price in 1991: $14,513
New Car Value (2011): $19,900

The top three cars are all popular sedans, including the 1991 Toyota Camry. What makes them attractive to thieves is that these makes and models are easy to steal and the parts don’t change much from year to year. The Camry is known for its quality and reliability and great resale value. As a result, it’s a popular target for thieves all across America, from Delaware to Florida, Kansas, California and Hawaii.

02. 1995 Honda Civic
Trade-In Value*: $1,100
Original Price in 1995: $11,970
New Car Value (2011): $17,400

The Civic gets great reviews and is one of the best-selling compact cars. People love them for their great fuel efficiency, reliability, repair history and resale value, according to Kelley Blue Book. It’s also pretty roomy inside, despite being a compact. Thieves love them for their parts. Cars like the Camry and Civic make the most-stolen list just about every year though the model year generally goes up one.

01. 1994 Honda Accord
Trade-In Value*: $975
Original Price in 1994: $15,430
New Car Value (2011): $20,200

The Accord is loved by both drivers and thieves and is universally stolen all over America. Drivers love it for its quality and refinement. It handles well, rates high on safety and maintenance and has a roomy interior. Thieves, of course, love them for their parts, which don’t change much from year to year, and for their lack of anti-theft technology.
Via Link

World top ten hardest working countries

10. Slovenia
 Average Hours Worked: 8.15
Slovenia rounds out the top 10 in terms of average hours worked among the population of OECD member states, possibly as a result of the fact that Slovenians do three hours and 51 minutes of unpaid work each day, 24 minutes more than the OECD average. Slovenia also has the lowest income inequality in OECD and the ninth – lowest relative income poverty rate at 7.8 percent of its population. Slovenia registered a big fall in infant mortality in the last generation and has the second lowest rate in the OECD of 2.1 per 1,000 live births, just after Luxembourg. But the country is rated in the highest third of the OECD for perceived corruption and the lowest third for confidence in national institutions. The Organization for Economic Cooperation and Development’s (OECD) released its ‘Society at a Glance’ survey, which investigated the number of hours the population of its member countries spent in both paid and unpaid work (defined as working at home or doing volunteer work), as well as how much time people spent in leisure activities. Lets take a look at which countries are among the world’s busiest and hardest-working nations? 
09. USA
Average Hours Worked: 8.16
According to the OECD the U.S. is only ranked ninth among the hardest working nations. However, at $31,000, the U.S. has the second – highest average household income after taxes and benefits in the OECD, after Luxembourg. But U.S. income is distributed relatively unequally, with both the fourth – highest rate of income inequality and relative poverty (17.3 percent of people are poor compared to an OECD average of 11.1 percent) in the OECD. People in the U.S. have a life expectancy of 77.9 years, lower than the OECD average of 79.3 years, despite having the highest public and private spending on health at 16 percent of GDP, considerably higher than the OECD average of 9 percent.

08. New Zealand
 Average Hours Worked: 8.18
New Zealand may not be famed for its work ethic, but it actually ranks quite high. Unpaid work in New Zealand accounts for 43 percent of Gross Domestic Product (GDP), the third highest in the OECD after Australia (46 percent) and Portugal (53 percent). Along with Israel, Iceland and Turkey, New Zealand is one of only four OECD countries with a fertility rate at 2.14 children per woman, sufficient to replace the population in the coming generation.

07. China
 Average Hours Worked: 8.24
The research also included non-OECD member countries such as China, India, South Africa, and Brazil because all are “enhanced engagement countries” — which means OECD members have opted to forge a more structured and coherent partnership with them. The research states that, at less than an hour, both men and women spend very little time on unpaid work in China, in comparison with other countries, particularly in terms of cooking and cleaning. Meanwhile, at 12.29 births per 1,000 of the population, China has one of the lowest birth rates in the world, equal to France and the United Kingdom. The average birth rate stands at 1.54 children per woman.
06. Austria
 Average Hours Worked: 8.29
At nearly 8 1/2 hours of work per day, Austrians have the sixth – highest total time spent working – both paid and unpaid – in the OECD. (The OECD average is 8 hours.) Austria also has the fifth – lowest unemployment rate in the OECD at 4.8 percent – far lower than the average OECD rate of 8.1 percent. Austria has low income inequality and poverty rates with around 7.2 percent of the population on relatively low income or classed as being in poverty in both cases.

05. Estonia
 Average Hours Worked: 8.36
At 8 hours and 36 minutes, Estonians – yes we did say Estonians – have the fifth – highest total work time in the OECD, well over the OECD average of 8 hours and 4 minutes. At 3 hours and 52 minutes, Estonians do the fourth – highest unpaid work time after Turkey, Mexico and Australia, and well above the OECD average of 3 hours and 28 minutes. However, at 14.1 percent , Estonian unemployment is also the third – highest in the OECD, six percentage points above the OECD average of 8.1 percent.

04. Canada
 Average Hours Worked: 8.37
Canadians have the second – highest rate of “positive experiences” in the OECD after Iceland – feeling well-rested, being treated with respect, smiling, doing something interesting, and experiencing enjoyment. At the same time, Canadians have above OECD average “negative experiences,” such as pain, worry, sadness, stress and depression. Canada has the sixth highest proportion of its population foreign-born in the OECD at 20 percent, nearly double the OECD average of 11.7 percent.

03. Portugal
 Average Hours Worked: 8.48
While some people might think that the Portuguese live a relaxed Mediterranean lifestyle, they in fact rank among some of the hardest – working in the world. Men do nearly two hours of unpaid work in Portugal, compared to less than an hour in other OECD countries such as Korea and Japan. The amount of time devoted to unpaid work accounts for up to 53 percent of gross domestic product (GDP) in the country, the highest proportion of all OECD countries, compared to 19 percent of GDP in Korea. Meanwhile, 60 percent of the Portuguese population spends time cooking and cleaning, spending the third largest amount of time on household chores at 110 minutes per day.

02. Japan
 Average Hours Worked: 9

The second-hardest working nation among OECD member countries will probably come as no surprise to anybody. Japan’s adherence to its work ethic is legendary with company employees often competing to stay at work later than their colleagues to achieve promotion in many corporations, where company loyalty is demanded and where a job for life still means life. Japanese people work an average 9 – hour day while the unemployment at 5.3 percent is well below the OECD average of 8.1 percent.

01. Mexico
 Average Hours Worked: 9.54
Recently, Richard Hammond of the TV program “Top Gear” managed to upset the Mexican Ambassador to the U.K. by suggesting that Mexicans were “lazy, feckless, flatulent [and] overweight”. The OECD’s research, however, may go some way to ward redressing the balance by showing that the Mexican people are in fact the hardest working in the world, working a total of nearly 10 hours on average every day. They also have the second-highest level of income inequality and the highest level of relative poverty among OECD countries.

Via : CNBC

Thursday, 3 February 2011

Rock Garden of Chandigarh | Cultural Place in India | The Rock Garden -Tourist Place in Chandigarh

The Rock Garden of Chandigarh is a 40-acre park full of plazas, waterfalls and thousands of unique creatures made from recycled materials. It’s a truly impressive sight, but even more so is the story of how Nek Chand spent four decades creating it and how he kept it a secret, for years.

In 1958, Nek Chand was a road inspector for the Public Works Department, and was making rafts and boats to be sail upon the recently created Sukhna Lake, but peddle boats were soon made available for rent by authorities, and his craft was banned. This allowed Nek to devote more time to his passion for rocks and stones, and he began gathering them from the nearby Shivalik Hills, and the Sukhna Cho, Patiala Rao and Ghaggar rivers. It was around this time that the Swiss architect Le Corbusier was asked to design the city of Chandigarh, the first planned city of India, and the small villages around the area were demolished. This provided Nek Chand with plenty of material for his increasing collection of rocks.
More images after the break...
Note: If you enjoyed this post and wish to be informed whenever a new post is published, then make sure you Subscribe to our regular Email Updates!
In 1965, after putting together an impressive collection of waste from the destroyed villages, Nek Chand began dreaming of a fairytale kingdom of his own. After all, he was working on creating the utopian city of Chandigarh, so he wondered if he couldn’t create a world of his own, out of the rabble he spent so much time gathering. He found a secluded gorge, in the forest on the outskirts of the city, and decided that’s where he was going to build his magical kingdom. At the end of each work day, he would disappear into the forest and tend to his vision, at the light of burning tires. Nek was afraid this dream of his would cost him his job, since it was very much an illegal project, but this didn’t stop him from expanding the Rock Garden with each passing day. Shards of broken pots and bottles, brick fragments and natural stones, these were the main ingredients used to create a unique world, inhabited by marvelous creatures.
Eventually, he built up the courage to see M.N. Sharma, Chandigarh’s chief architect about his marvelous project. Reluctant to accompany Nek Chand into the forest, this disciple of Le Corbusier eventually agreed. Although he should have had it demolished, Sharma later said the admiration for Nek Chand’s amazing Rock Garden and its creative potential was much stronger than his duty as chief architect, so he advised Nek to continue his work in secret, until he could convince the world that, though illegal and unauthorized, the Rock Garden is a masterpiece that should be preserved.
It took a year for M.N. Sharma to convince Indian authorities, but his efforts paid off, and Rock Garden finally got the recognition it deserved. Nek Chand received authorization to expand his project on another 25 acres, and the Rock Garden was open to the public, in 1976. Its creator worked under threat of imprisonment and the demolition of the project, for 18 years, but it all paid off, in the end. Ever since he first started working on it, recycling was a very important part, but after it was finally authorized, it became even more so. Nek set up waste collection centers across Chandigarh, at hospitals, hotels, restaurants and other big waste suppliers. He kept working on it, until just a few years ago.
Today, an estimated 5,000 people from all around India and abroad come to see Nek Chand’s Rock Garden, every day. It practically went from being a secret, unauthorized fantasy, to India’s second most popular tourist attraction, after the Taj Mahal. How is that for an incredible turn of events?
Photo Link

Note: If you enjoyed this post and wish to be informed whenever a new post is published, then make sure you Subscribe to our regular Email Updates!

Top 10 Oldest Mosque in the World | Top of the World

01. Quba Mosque, Saudi Arabia
First Built: 622
The designation of the oldest mosque in the world requires careful use of definitions, and must be divided into two parts, the oldest in the sense of oldest surviving building, and the oldest in the sense of oldest mosque congregation. Even here, there is the distinction between old mosque buildings that have been in continuous use as mosques, and those that have been converted to other purposes; and between buildings that have been in continuous use as mosques and those that were shuttered for many decades. In terms of congregations, they are distinguished between early established congregations that have been in continuous existence, and early congregations that ceased to exist (wikipedia). 09 More after the break...
Note: If you enjoyed this post and wish to be informed whenever a new post is published, then make sure you Subscribe to our regular Email Updates!
02. Al-Masjid al-Nabawi, Saudi Arabia
First Built: 622

03. Masjid al-Qiblatain, Saudi Arabia

First Built: 623

04. Jawatha Mosque, Saudi Arabia

First Built: 629

05.
Masjid al-Haram, Saudi Arabia

First Built: 638

06. Great Mosque of Kufa, Iraq

First Built: 639

07.
Mosque of Uqba, Tunisia

First Built: 670

08.
Imam Hussain Mosque, Iraq

First Built: 680

09.
Al-Aqsa Mosque, Jerusalem

First Built: 705

10.
Al-Zaytuna Mosque, Tunisia

First Built: 709

Via—Link

Note: If you enjoyed this post and wish to be informed whenever a new post is published, then make sure you Subscribe to our regular Email Updates!

Wednesday, 2 February 2011

Top 10 American Cities | Top of America | Informative Topics

01. Charleston
This South Carolina city bumped off perennial winner Miami this year; have the good-looking people really migrated north? Charlestonians also score high for friendliness, rank second for their classic sense of style, and even make the top 10 for intelligence. To see if it’s all true, just stroll the streets of this quaint city, which also ranks No. 1 for its noteworthy neighborhoods.

What makes the people of one city so good-looking and the folks elsewhere…well, not so much? Do some cities become magnets for the Greek god and goddess types, or does the mere act of living in a certain area actually have a transformative effect? Whatever the reasons, in this year’s America’s Favorite Cities survey, voters told us that good weather and great shopping go hand-in-hand with attractiveness. San Diego and Miami, for example, did well in all three categories, ending up among the top five cities to find America’s most attractive people. 09 More after the break...
Note: If you enjoyed this post and wish to be informed whenever a new post is published, then make sure you Subscribe to our regular Email Updates!

02. San Diego
Maybe it’s all those sunny blondes in this SoCal city, or just the fact that everyone looks good when the forecast is perfect (its weather ranks No. 1), but San Diego maintains its No. 2 ranking in this category from last year. Certainly the locals take good care of themselves, jogging along the beaches: the city also ranks No. 2 for its athletic citizens.

03. Savannah
This newcomer to the America’s Favorite Cities survey makes a bold entrance into this category. The Georgia city also racks up a huge number of No. 2 berths in the survey, thanks in large part to its ever-so-appealing denizens.

04. Miami
Who cares if these Floridians don’t come off as brainy or even terribly nice? AFC readers ranked them near the bottom for both friendliness and smarts. But though they’ve lost their grip on the No. 1 ranking in this category, Miamians are still top-five material. Perhaps that’s because they seem to be out at the gym (No. 10 for athletic) or just out shopping. Miami ranks No. 9 for luxury boutiques and No. 3 for style.

05. Salt Lake City
Salt Lake is a survey newbie, but that didn’t stop it from cracking the upper echelon of this list. And the Utah natives rank about the same as an overall package: they’re top 10 for being physically active, friendly, and intelligent. They’re a pretty trustworthy bunch too—the city ranks No. 1 for safety.

06. Honolulu
Those island breezes toss the hair in a nice way—and no doubt all that hula dancing nicely tones the abs. The locals in the Hawaiian capital rank sixth for staying fit. And if you want to seize the moment, Honolulu is also the No. 1 city for romance.

07. San Juan, Puerto Rico
San Juan is one of three newcomers to the survey that cracked the top 10 in this popular category. The locals here certainly know how to charm visitors in many ways: they also made it into the top 10 for friendliness and for dressing to the nines (No. 6 for style).

08. Austin
People in the Texas capital are smart (No. 5) and amiable (No. 8 for friendliness), and they stay in shape too (No. 4 for being active). Luckily, it’s fun finding them, too: Austin ranks No. 2 for both its live music and bar scene.

09. Denver
Even though the Mile High City ranks second for its microbrews, there’s no need to pack your beer goggles when coming for a visit. (The city did slip three spots from last year in this category, however.) Denver also ranks No. 2 for its parks and outdoor spaces, and the fit locals make the most of it, ranking No. 1 for being athletic.

10. Nashville
Something about those cowboy hats must flatter the face—and being able to sing doesn’t hurt either. Music City types don’t go for rhinestones as much as they used to, which maybe helped them land at No. 10 for style. But folks are still plenty country: they rank No. 10 for farmers’ markets and No. 3 for a howdy-there friendliness.
Via— Link

Note: If you enjoyed this post and wish to be informed whenever a new post is published, then make sure you Subscribe to our regular Email Updates!